

ScintPi can be described as a series of low-cost ionospheric scintillation and total electron content (TEC) monitors developed in our lab using commercial off-the-shelf (COTS) GNSS receivers and single-board computers (Raspberry Pi).
The first version of ScintPi (1.0) uses a single-frequency (L1) GPS receiver to make scintillation measurements. The design and examples of short and long-term observations of low-latitude ionospheric scintillation made with ScintPi 1.0 were presented by Rodrigues and Moraes (2019).
The latest versions of ScintPi (2.0 and 3.0) are presented and discussed by Gomez Socola and Rodrigues (2022).
Below we provide information about to build your own ScintPi 1.0 and make observations of ionospheric scintillation on GPS signals:
INTRODUCTION
Ionospheric scintillations are fluctuations in the amplitude and/or phase of radio signals caused by irregularities in the ionospheric plasma density.
ScintPi measures the amplitude of signals transmitted by GPS satellites to detect scintillation and determine the occurrence of ionospheric irregularities.
SCINTPI: COMPONENTS
To build a ScintPi 1.0 one can use the components listed below and shown in Figure 1:
- Raspberry Pi 3 Model B case
- Raspberry Pi 3 Model B
- GPS Antenna – External Active Antenna
- USB to TTL Serial cable
- SMA to uFL adapter cable
- Adafruit Ultimate GPS Breakout
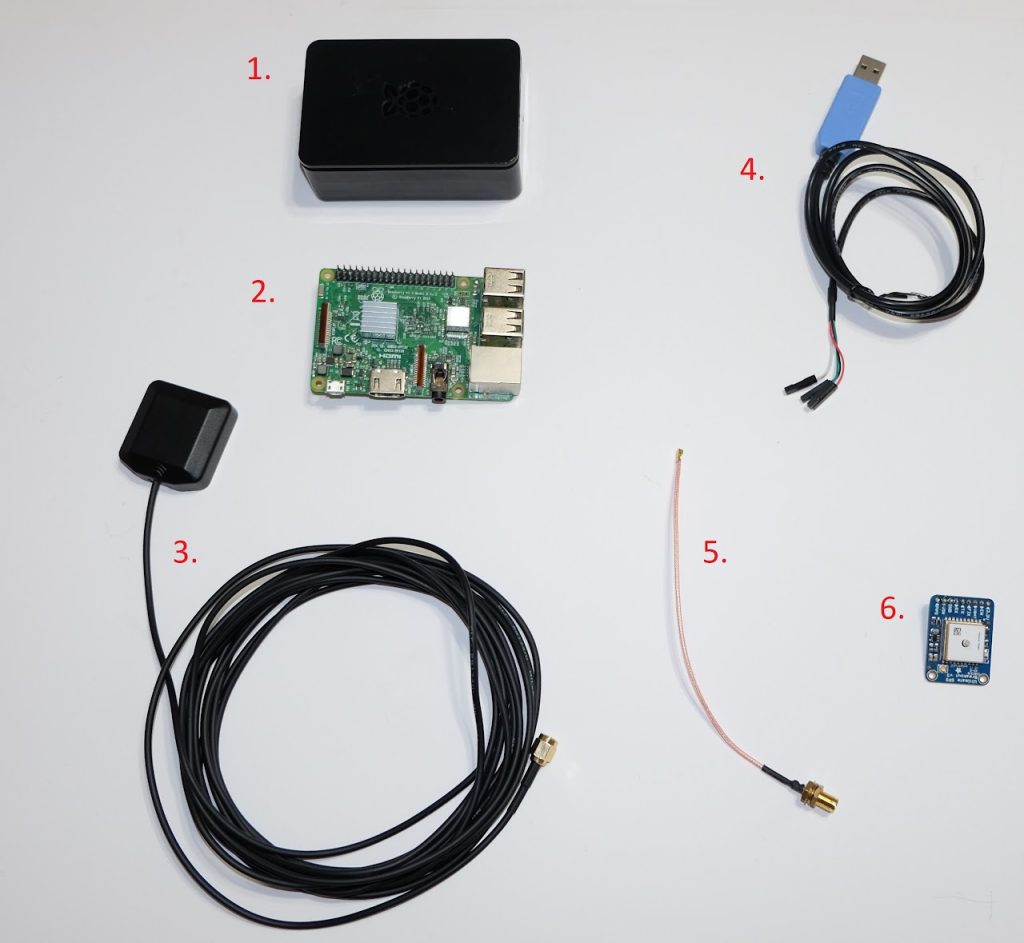
Figure 1 – Components of ScintPi 1.0.
The Raspberry Pi and case can be found at:
The Adafruit GPS, USB to TTL serial cable, and antenna can be found at:
CONNECTING THE GPS
The first step consists of connecting the GPS receiver to the Raspberry Pi. This is done using the USB-to-TTL cable. Connect the red cable to the VIN pin, black to GND, green to RX, and white to TX. See Figure 2.
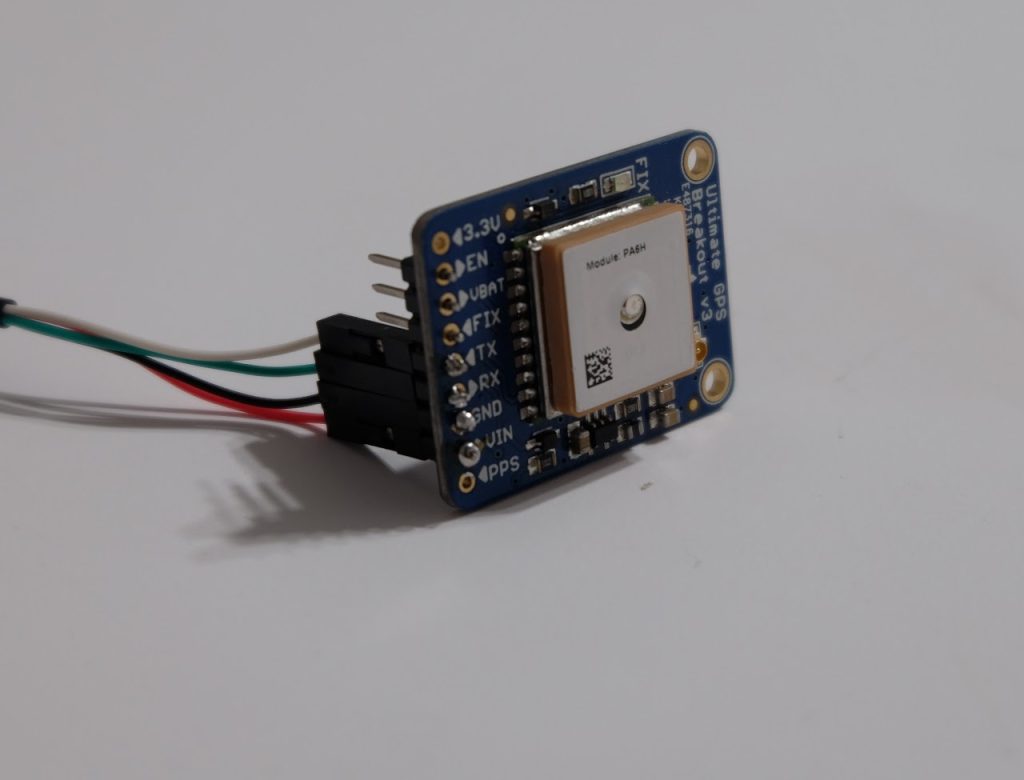
Figure 2 – Adafruit GPS to USB serial cable connection.
The second step consists of attaching the antenna to the GPS receiver. This is done using the SMA-to-uFL adapter. Attach the uFL connector to the Adafruit GPS as indicated in Figure 3 Then, connect the external antenna to the SMA connector of the adapter.
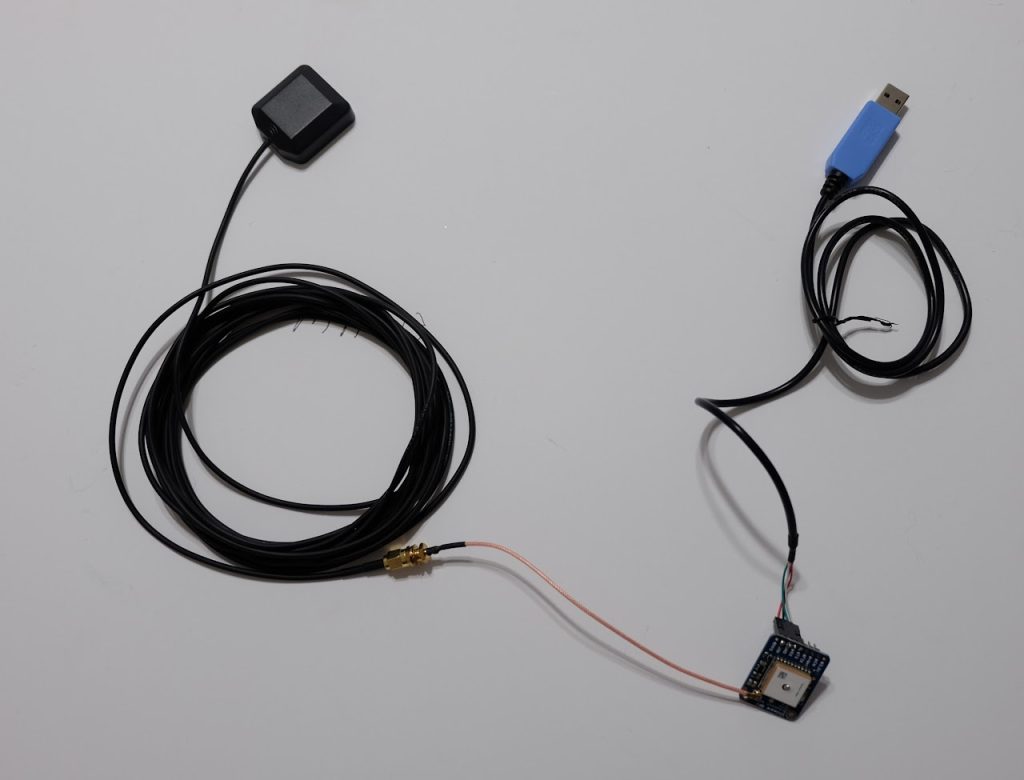
Figure 3 – Antenna and USB connected to GPS.
Alternative: Adafruit Hat
One may choose to use the Adafruit GPS HAT receiver. Doing so will bypass the need for a USB to TTL serial cable. To attach the hat, simply connect the hat to the Raspberry Pi GPIO port as shown in Figure 4 and directed in the instructions provided by the HAT. Cases that are compatible with the HAT are sold online.
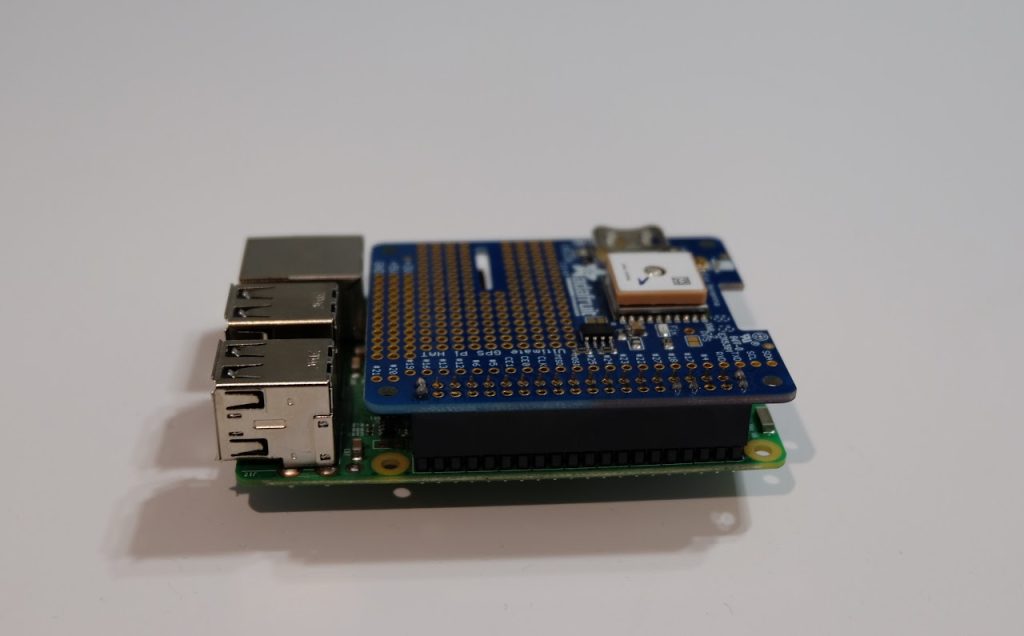
Figure 4 – Adafruit GPS HAT connected with Raspberry Pi.
SOFTWARE: CREATING THE PROJECT FOLDER ON THE PI
Install the latest version of the Raspbian OS on your Raspberry Pi via the NOOBS installer. For help with this, see the guide here: https://projects.raspberrypi.org/en/projects/raspberry-pi-setting-up/ .
Next, create a new directory for the project. For instance:
mkdir /home/pi/scintpiNow you are ready to copy the files (ScintPi data acquisition software) into this folder. We made the data acquistion software available in the following public repository: http://doi.org/10.5281/zenodo.4905194
SOFTWARE: CONFIGURING CRONTAB
Crontab allows Linux operations to be run on a schedule. This will allow continuous operations of ScintPi and compression of daily files. To edit the crontab, run the command:
crontab -eIn this file, we add in lines corresponding to a daily reboot, running of the data acquisition software at startup, and periodic file compression. The commands should match the location and name of the ScintPi project folder, for the directory scintpi at /home/pi/scintpi , we have the following:
59 23 * * * sudo reboot
@reboot (sleep 180; /home/pi/scintpi/scintpi_gpio_v1 >> /home/pi/scintpi/cronlog 2>&1 )
00 01 * * * /home/pi/scintpi/filezipper
The first portion of the crontab command controls the minute, hour, day, month, and year, respectively, of when the command is to be executed. Asterisks indicate ‘all’, so “59 23 * * * sudo reboot” runs the sudo reboot command every day of every month in every year at 23:59 local time.
In the reboot command, on Scintpi startup we wait three minutes to allow the Adafruit to initialize and then run the data collection script. The crontab log file is directed into a textfile in the ScintPi project folder.
Exit then save with Ctrl-X. If configured correctly, you should see this confirmation:

Next, disable the network time protocol. This disables the automatic update of system time. Run the command:
timedatectl set-ntp false SOFTWARE: RUNNING SCINTPI
Connect the GPS receiver to Raspberry Pi using the USB port (as indicated in Figure 5). Note, however, that for proper operation and measurements the antenna must be placed outdoors and free of obstructions blocking GPS signals.
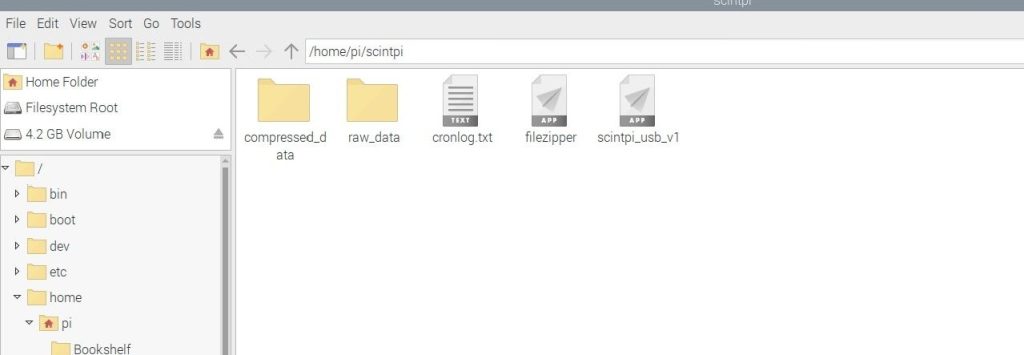
If configured properly, the Adafruit GPS receiver will blink red. A text file (extension .dat) will appear in the following folder:
/home/pi/scintpi/raw_data/
The .dat file name should contain ScintPi’s location (coordinates) and current date. For example, the file:
scintpi_1157.1380S_07652.5487W_20200422_0002.dat
would be created for ScintPi located at 11.57 deg. S and 76.52 deg. W on April 22, 2020.
Data files more than a day old will be compressed as a .zip file and moved to the /compressed_data/ subdirectory.
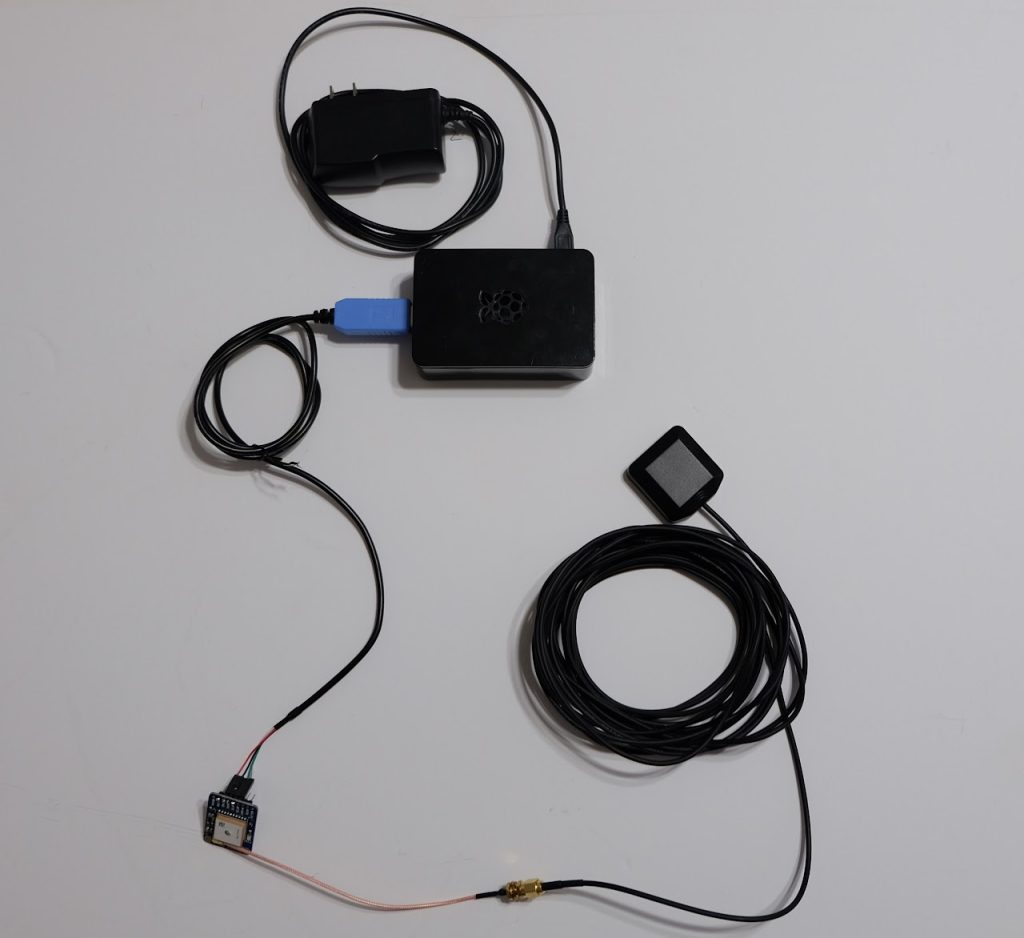
Figure 5 – Overall setup of the ScintPi.
DATA VISUALIZATION
In the public repository (http://doi.org/10.5281/zenodo.4905194) where we made available the acquisition software, we also provided software for processing of the data files and visualization of the scintillation indices.
The software is a Windows OS executable (plot_scintpi1.exe). An example of a summary plot created by this software is shown in Figure 6. The software also outputs an hdf file with the processed values shown in Figure 6.

Figure 6 – Example of daily observations.
Figure 6 shows an example of visualization of the measurements in one daily file. Each panels shows data for a single GPS satellite. The satellite identifier number (PRN) is indicated on top of each panel.
In each panel, the black line represents the signal-to-noise ratio (SNR) of the GPS signal. The blue line represents the so-called S4 scintillation index value (standard deviation over the mean of the signal intensity).
For a good install, with an antenna away from obstacles and multi-path. S4 values above 0.2 indicate ionopsheric scintillation. Finally, the red line shows the elevation of the GPS satellite.
PROJECT FILES
The data acquistion (Raspian OS) for ScintPi (USB connection) and visualization software (Windows OS) is provided in the following public repository:
http://doi.org/10.5281/zenodo.4905194
Note that the software is provided “as is” for educational purposes, without warranty of any kind.